RHIZA – Making digital farming work for you
MARCH, 2026
Blog
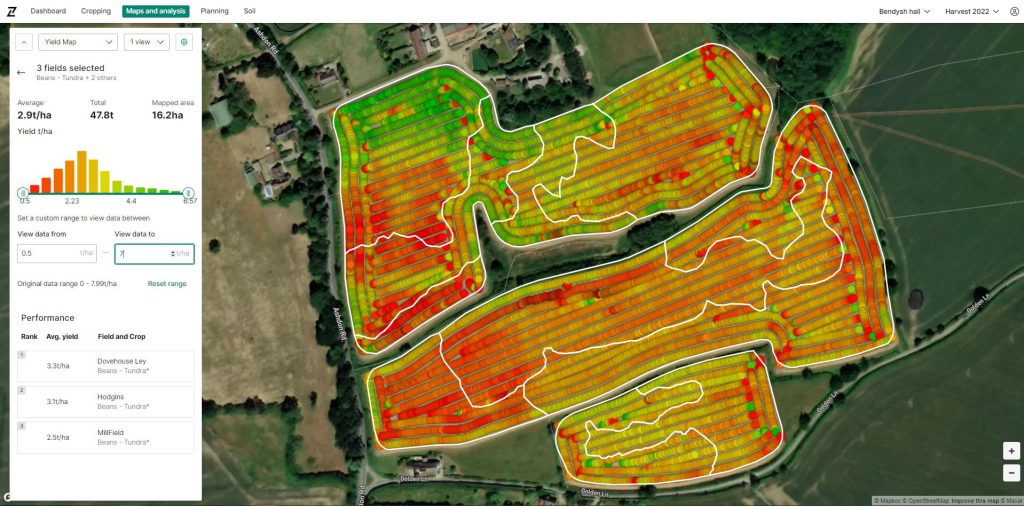
Combine yield maps can provide much more than a record of harvest. Reviewed across several seasons and alongside other field data, they can help identify areas that consistently perform differently and support more targeted management decisions.
An earlier harvest can create a useful window to review that information before autumn drilling begins, particularly where several years of yield data are already available.
For RHIZA Product Manager Ben Foster, the opportunity is to move beyond simply looking at which fields or varieties performed well and start identifying where performance is consistently being lost within individual fields.
“The longer period between harvest and autumn drilling gives growers time to review which varieties were successful, as well as pinpointing areas of fields that performed well and those that didn’t.”
Using yield maps to identify persistent field variation
A single yield map can show variation from one season, but its value increases when data from several years is compared.
This can help distinguish a one-off seasonal effect from an area that consistently underperforms because of factors such as soil type, drainage, establishment, nutrient availability or other field characteristics.
Ben says this is where yield data can begin to support more useful commercial decisions.
“One of the biggest areas where I see farms losing money is through farming unprofitable land.
“With harvest complete, now is the perfect time to use yield data to ask: should I be farming this land in the same way?”
The answer will not always be to take land out of production. In some situations, the data may point towards a different management approach, a change in input strategy or the use of environmental options where these fit the farm business.
Looking beyond a single season
Sam Fordham, Head of Technical at RHIZA, has used historic combine yield maps on his own farm to assess longer-term field performance.
He compared around eight years of yield data, covering two full rotations, and normalised the results to create a clearer picture of how different parts of the field had performed over time.
“I stacked around eight years’ worth of yield maps on top of each other, normalising the output, to give a really well visualised map of how the field performed in each area.”
This highlighted the parts of the field that showed the weakest long-term trend and allowed Sam to assess the basic gross margin being generated in those areas.
“I worked out my output over the eight years, covering two full rotations. From there, I could calculate what my basic gross margin per hectare was for each area.”
Using field performance data alongside SFI options
Historic yield data can also help inform decisions around environmental schemes, although Sam stresses that this should not simply mean identifying lower-performing land and automatically removing it from production.
On his own farm, the preferred approach was to retain some areas in production while using suitable in-crop SFI options to change how they were managed.
“By stacking SFI in-crop options, such as PRF1 variable rate, no insecticide and companion cropping, I could significantly increase gross margins in those areas without negatively impacting the positive areas of the field.”
The example shows how yield data can be used as part of a wider decision rather than treated as an answer in isolation.
Turning yield data into practical decisions
Modern combines already collect large amounts of yield data. The challenge is making that information useful.
RHIZA and Contour bring yield data together with other field information so growers and agronomists can investigate the causes of variation and decide what action, if any, is appropriate.
“With RHIZA and Contour, we do the heavy lifting and identify the issues in order to provide the solutions,” says Ben.
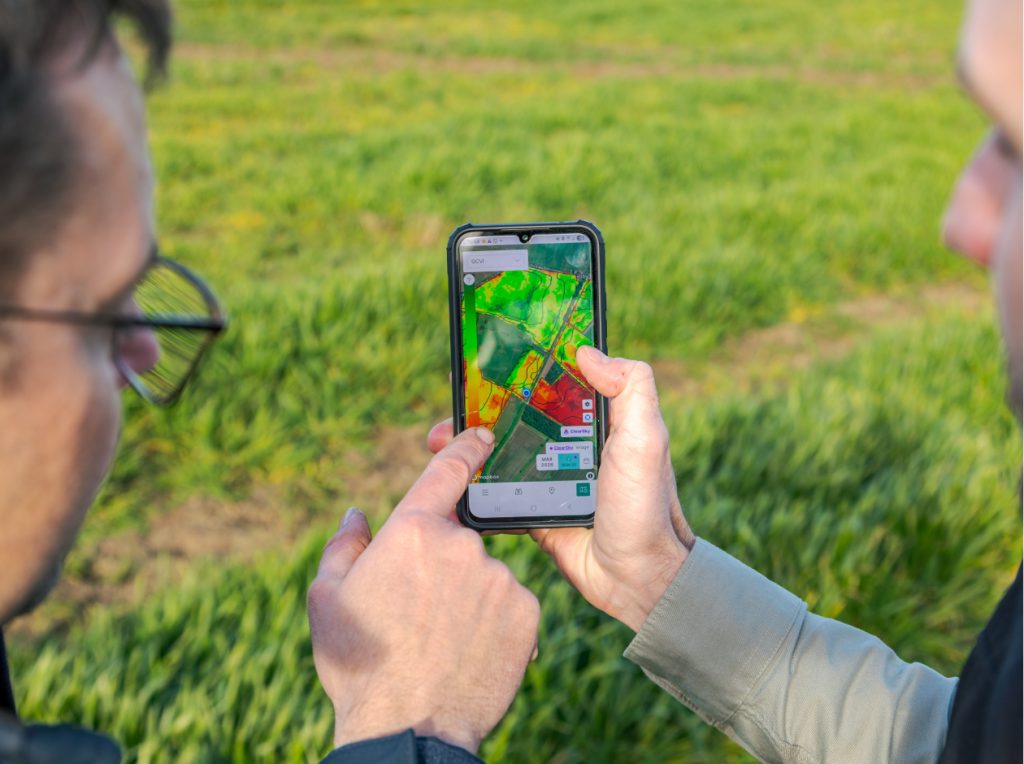
Contour can be used to compare combine yield maps with information including soil analysis and satellite imagery, helping build a broader picture of how a field is performing.
“Contour is a really good way to analyse yield data against a variety of other sources of information, such as soil analysis and satellite imagery,” Ben adds.
Comparing yield maps with satellite imagery
Satellite imagery can add another layer of information by showing variation in crop development earlier in the season.
Comparing this with the final yield map can help determine whether patterns seen in spring are reflected at harvest and where further investigation may be worthwhile.
Ben says this relationship is often clear in the fields he works with.
“Nine times out of ten, if you look at the variance in a satellite image in March or April, that variance will reflect the yield map in the summer.”
This does not necessarily identify the cause of the variation, but it can help narrow down where to look and where further soil, crop or field assessment may be needed.
Make more use of the data already being collected
Yield maps are most useful when they are treated as part of a longer-term field record rather than viewed once at harvest and then filed away.
Combining several seasons of yield data with soil information, satellite imagery and agronomic knowledge can help identify persistent patterns and support more targeted decisions around inputs, cropping and environmental management.
The value comes from moving from data collection to interpretation, and then deciding what action is appropriate for each part of the field.
Speak to the RHIZA team or your Agrii agronomist about using historic yield data within Contour to understand field performance and support future management decisions.