RHIZA – Making digital farming work for you
APRIL, 2026
Blog
Satellite imagery is now widely available to growers, but the different indices and image types can make it difficult to know which one to use and what the data is actually showing.
NDVI, NDRE, GCVI, RGB and radar-based imagery each provide a different view of crop development. Used in the right context, they can help identify variation across a field, monitor crop development and support more targeted decisions.
The key is understanding what each image represents, where it is most useful and when it needs to be checked against what is actually happening in the field.
What NDVI shows
Normalised Difference Vegetation Index, or NDVI, is one of the most commonly used forms of satellite imagery in agriculture.
It is based on the way healthy vegetation absorbs red light for photosynthesis and reflects near-infrared light. The contrast between these wavelengths is used to indicate relative crop greenness and, to a degree, biomass.
Jonathan Trotter, Technology Trials Manager at Agrii, says it is important not to treat NDVI as a direct measure of plant health.
“NDVI is a relative greenness index rather than a direct plant health index. It is useful for monitoring changes in relative greenness over time, which can then be related to plant health.”
One of NDVI’s strengths is that it operates on a fixed scale from -1 to 1, which makes images from different dates directly comparable.
Ben Foster, RHIZA Product Manager, says this makes it particularly useful for monitoring establishment and crop growth from early to mid-season.
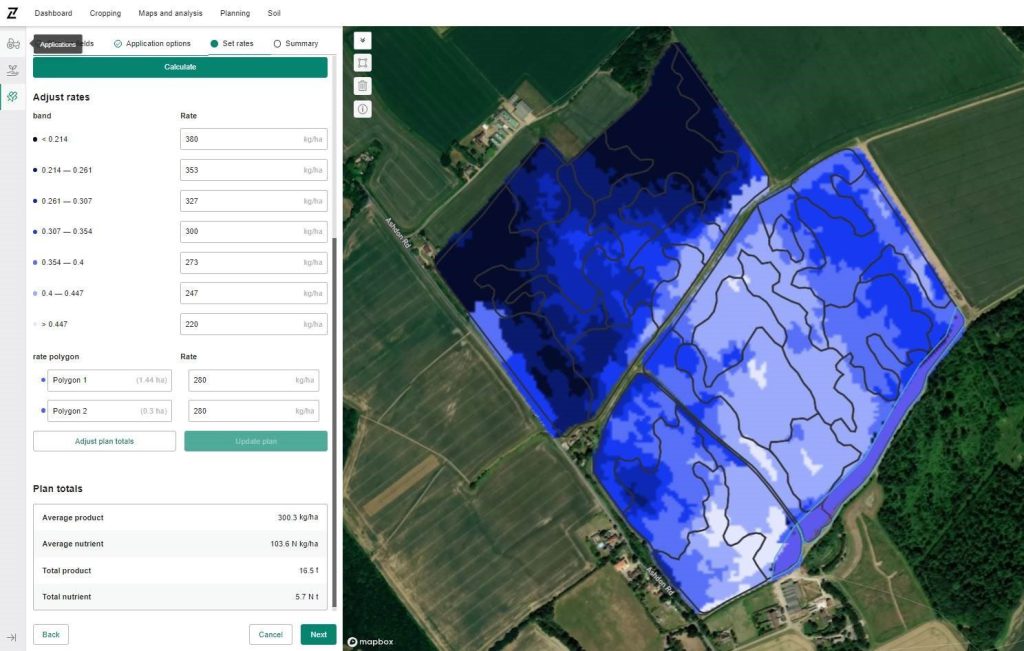
“NDVI tends to be the go-to for developing variable rate nitrogen plans for early spring because you can compare how the crop has changed over time.”
Why NDVI needs field context
NDVI can show that one part of a field differs from another, but it does not explain the reason for that variation.
A lower or higher value could be associated with crop nutrition, drought, soil type, establishment, disease, weeds or other factors.
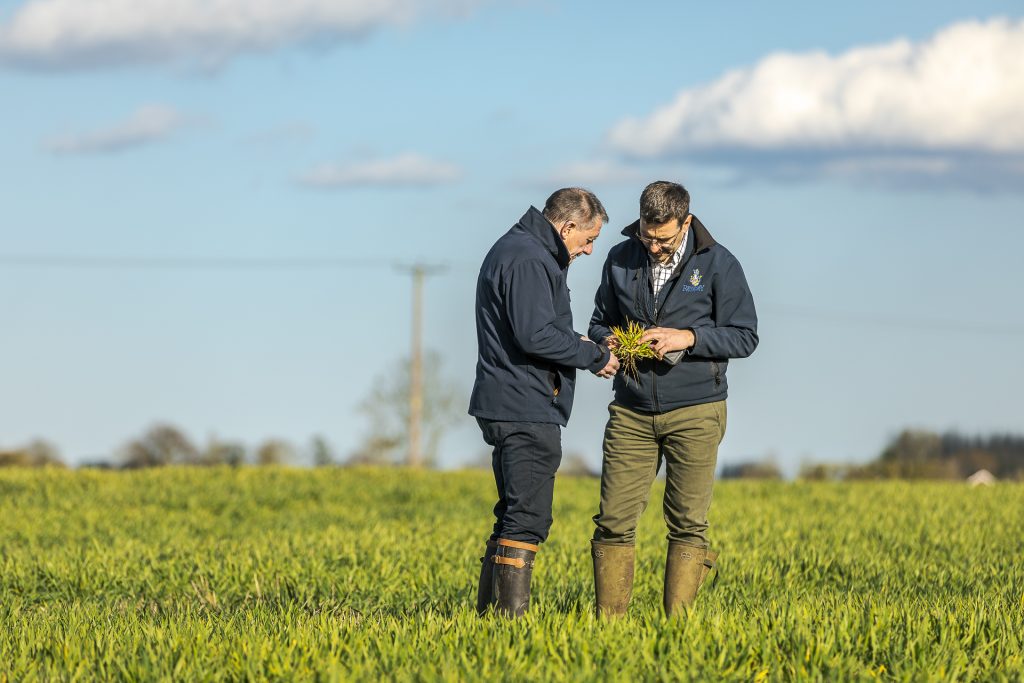
Jonathan says this is why satellite imagery should be ground-truthed rather than interpreted in isolation.
“Farmers need to know if an NDVI score of 0.58 in a wheat crop is good or bad. Is it showing stress from inadequate nutrition? Is it actually showing signs of drought? Or is it doing well for that soil type with the recent weather? It needs context and ground truthing.”
Separating crop biomass from weeds
Satellite imagery records the vegetation visible within the pixel. That can include both the crop and weeds.
This was demonstrated at Agrii’s Scottish Digital Technology Farm, where NDVI imagery showed darker green areas that appeared to have greater biomass.
The team used Skippy Scout to examine the field at much higher resolution.
Skippy Scout can assess Green Area Index and use AI to identify weed species, allowing weeds to be excluded from the crop biomass assessment.
“In this example, we discovered that a percentage of this relative greenness was actually due to annual meadow grass in the crop and were able to adjust our variable rate strategy to account for this,” explains Jonathan.
Combining satellite imagery with drone-based assessment can therefore help distinguish whether variation is being caused by the crop itself or other vegetation within the field.
“By ground-truthing NDVI with drone imagery, we effectively tune up the resolution of remote sensing from 5–20 m² down to cm²-level data.”
When NDVI becomes less useful
NDVI becomes less sensitive as crop canopies become denser because the index can begin to saturate.
This means it is often more useful during establishment and early to mid-season growth than when a crop has developed a full canopy.
At this point, other indices can provide additional information.
Using NDRE later in the season
Normalised Difference Red Edge, or NDRE, uses wavelengths in the red-edge and near-infrared parts of the spectrum.
Because it is less prone to saturation in dense crops than NDVI, it can be more useful later in the season when canopy development is more advanced.
NDRE is often used to assess differences in chlorophyll concentration and crop nitrogen status in denser canopies.
Where GCVI fits
Green Chlorophyll Vegetation Index, or GCVI, is another option for assessing crop variation.
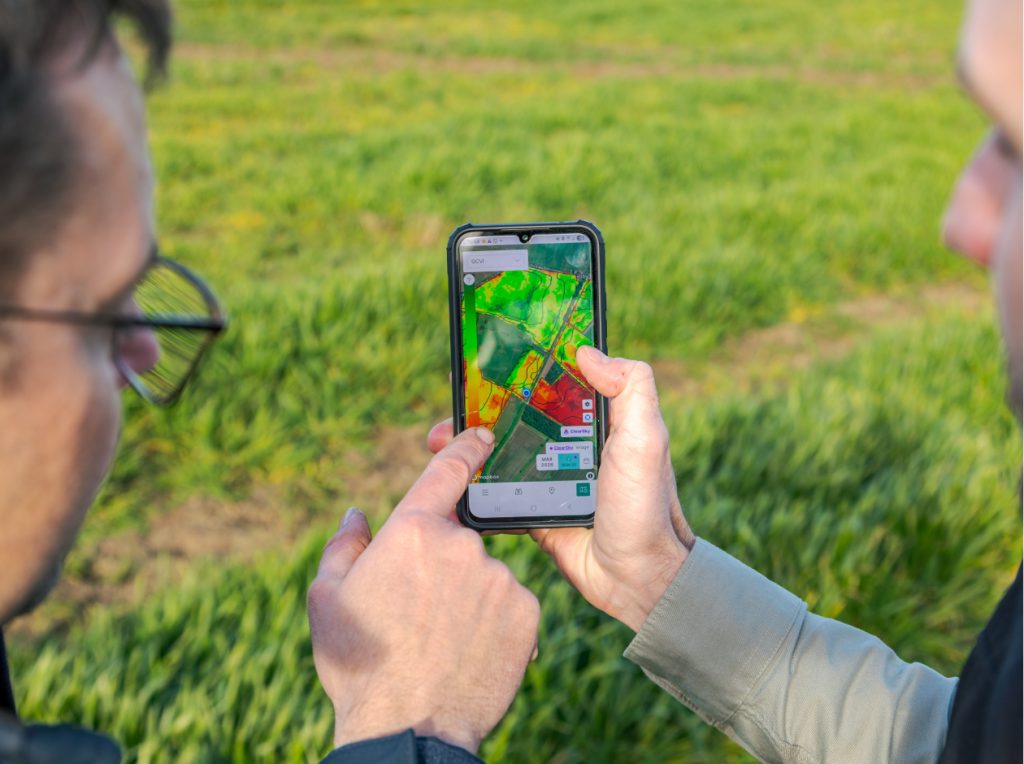
GCVI uses green reflectance and near-infrared wavelengths and is one of the satellite imagery options available within Contour.
Ben explains that its interpretation differs from NDVI because the scale is relative to the image being viewed rather than fixed.
“GCVI looks at green reflectance rather than red, which is more responsive to variations in leaf chlorophyll.
“You could look at a GCVI image and see what appears to be a poor part of the field, but it is relative to the rest of the field. Again, this makes a farmer’s understanding of their fields and ground-truthing satellite imagery crucial.”
Managing cloud cover with radar imagery
Optical satellite imagery depends on having a clear view of the crop, which can be a limitation in the UK.
Long periods of cloud can mean that suitable optical images are unavailable at the point when a management decision needs to be made.
Contour addresses this through access to ClearSky radar-derived imagery.
Synthetic Aperture Radar, or SAR, uses microwave signals rather than visible light. These signals can pass through cloud and provide information in conditions where optical imagery is unavailable.
“The Contour platform has access to ClearSky, which can penetrate cloud cover,” says Ben.
“Satellites fire radar waves at the crop, which interact with the canopy before being detected by the satellite. We model that information in Contour so it can be viewed in a form similar to NDVI.”
This provides another way of monitoring crop development when cloud prevents useful optical imagery being collected.
What hyperspectral imagery could add
Hyperspectral imagery uses a much greater number of wavelength bands than conventional multispectral satellite imagery.
In principle, this can provide more detailed information about crop characteristics and plant condition.
Jonathan says the technology has potential, but cautions against assuming that more spectral data automatically leads to better agronomic decisions.
“Although hyperspectral imagery has advantages in being able to monitor plant health across greater spectral ranges, without ground-truthing the data or interpreting the context with a detailed understanding of what is going on within the soil, it presently offers little over and above current capabilities.”
Availability can also be an issue, as hyperspectral systems are currently less widespread and are still affected by cloud and atmospheric conditions.
The main satellite imagery types at a glance
| Index | Data type | Best used for | Key consideration |
|---|---|---|---|
| NDVI | Red + near infrared | Early to mid-season crop vigour and relative biomass | Fixed scale allows comparison over time, but can saturate in dense canopies |
| NDRE | Red edge + near infrared | Mid- to later-season crop monitoring | Less prone to saturation in dense canopies and useful for assessing chlorophyll variation |
| GCVI | Green + near infrared | Canopy development and chlorophyll variation | Relative to the image, so field context is important |
| SAR | Microwave radar | Monitoring when cloud prevents optical imagery | Works through cloud and can provide information on crop structure and biomass |
| RGB | Visible red, green and blue wavelengths | Visual inspection and scouting | Easy to interpret visually but provides less physiological information than multispectral indices |
Use the right image for the decision
There is no single satellite index that provides the best answer throughout the season.
NDVI can be useful for monitoring establishment and early crop development, while NDRE and GCVI can provide additional information as the canopy develops. Radar imagery can help maintain visibility when cloud limits conventional satellite imagery.
The value comes from selecting the appropriate data source for the decision being made and combining it with field knowledge, crop walking, soil information and other measurements where appropriate.
Satellite imagery can show where something is different. Agronomic interpretation is still needed to understand why.
Speak to the RHIZA team or your Agrii agronomist about using satellite imagery within Contour to monitor crop variation and support more targeted field decisions.