How variable rate technology is lifting wheat yields on a Wiltshire farm
Improving the weakest-performing parts of a field, rather than simply pushing the best areas harder, has helped one Wiltshire farming business lift average wheat yields by around 1 t/ha.
Matt Fry of WG Fry & Son is using variable rate seed, P and K and nitrogen plans alongside RHIZA soil data and Contour satellite imagery to make more targeted decisions across the farm.
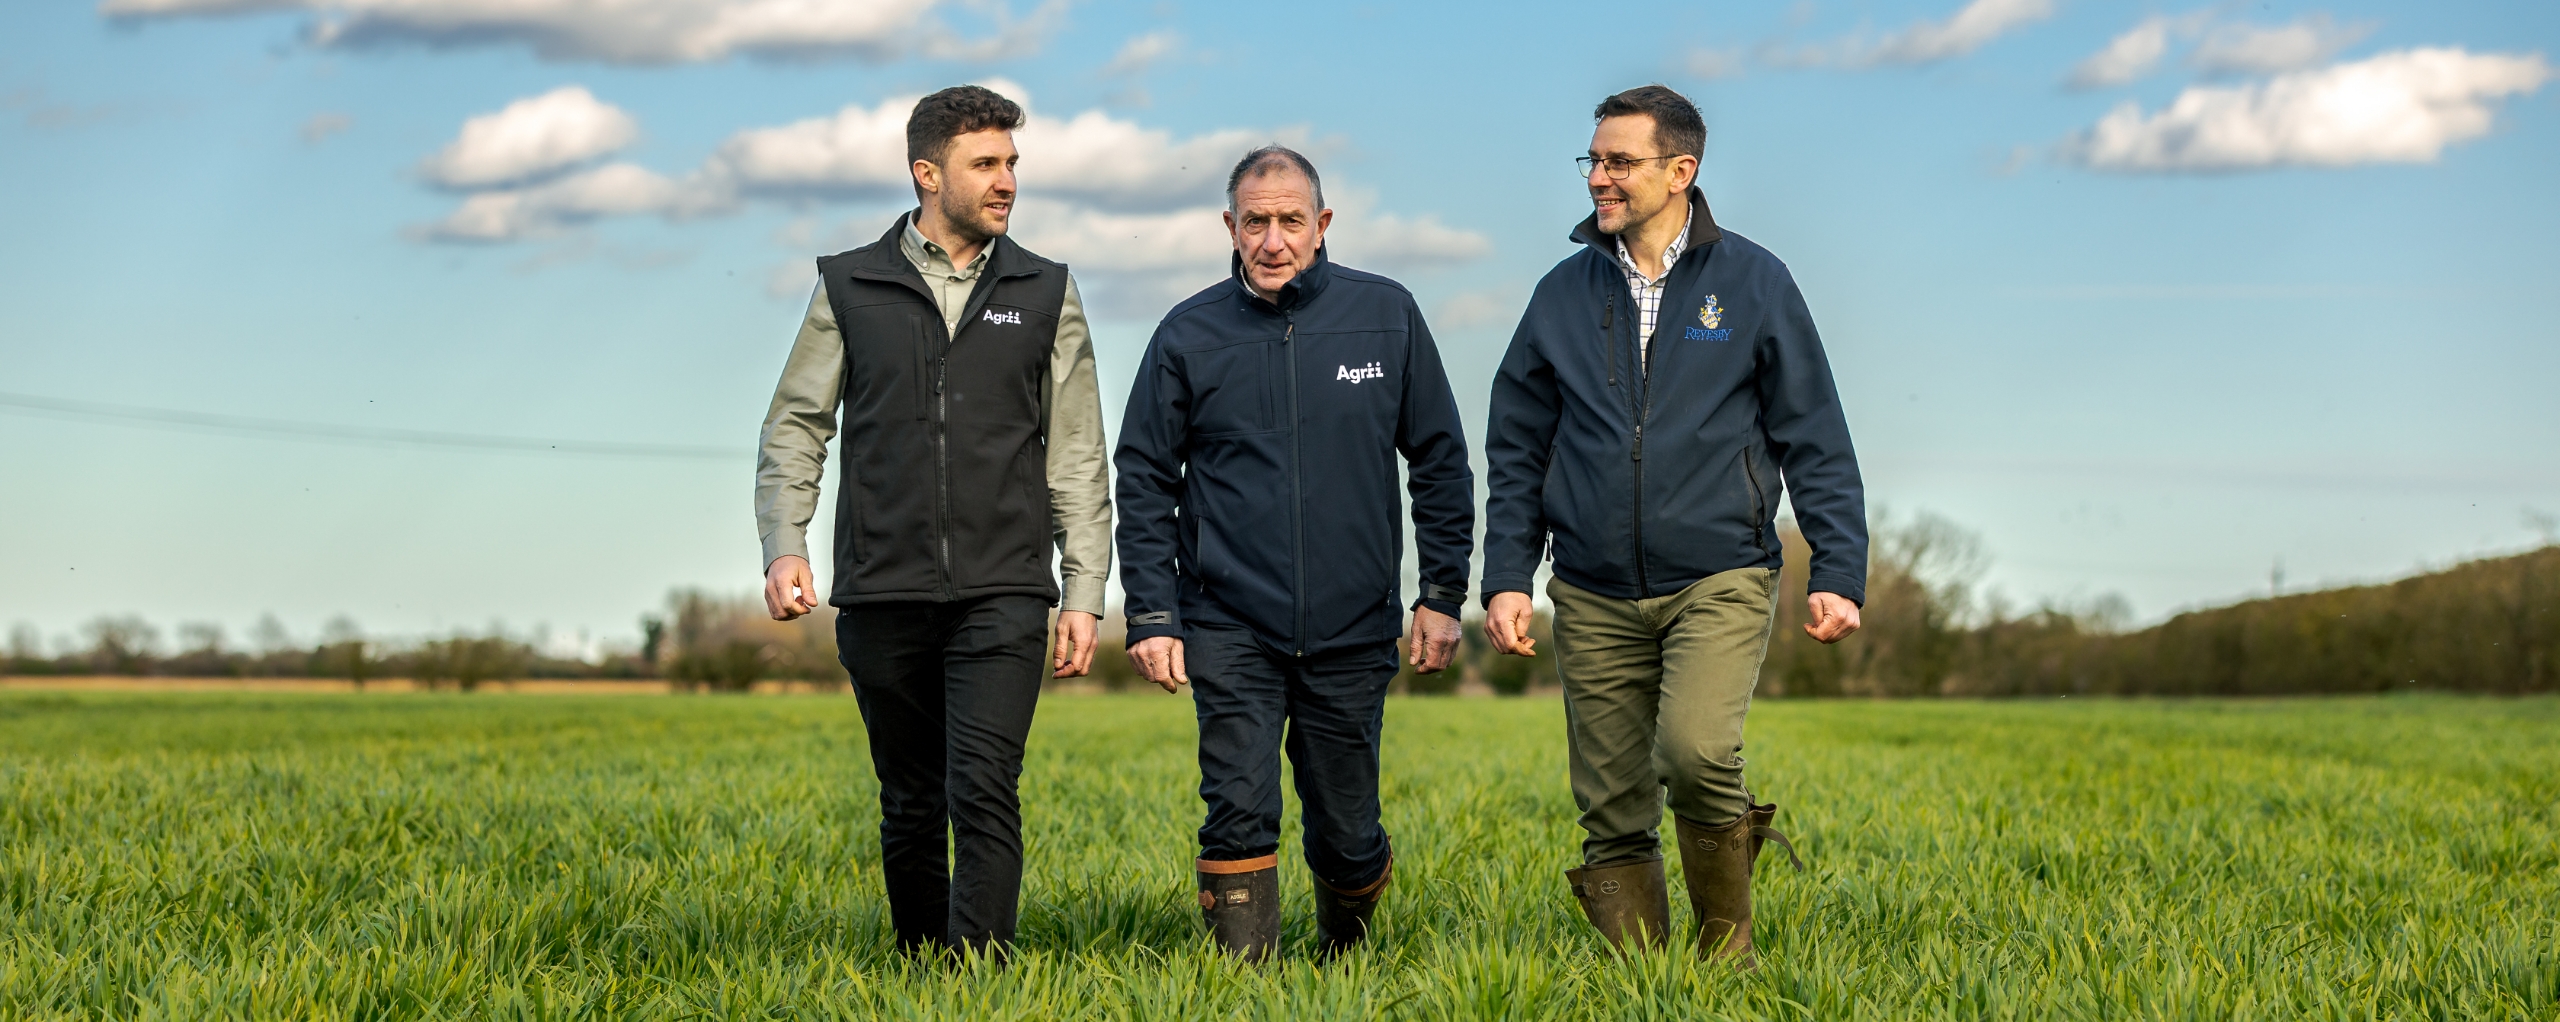
Working with Agrii agronomist Roy Willis, the aim is to improve field consistency while keeping additional input costs in proportion to the likely return.
Focusing on the weaker parts of the field
WG Fry & Son operates across 14 different farm units under rental and contract farming agreements.
Matt says pushing yields as far as is economically justified is important to generating sufficient return for both the business and its landowners.
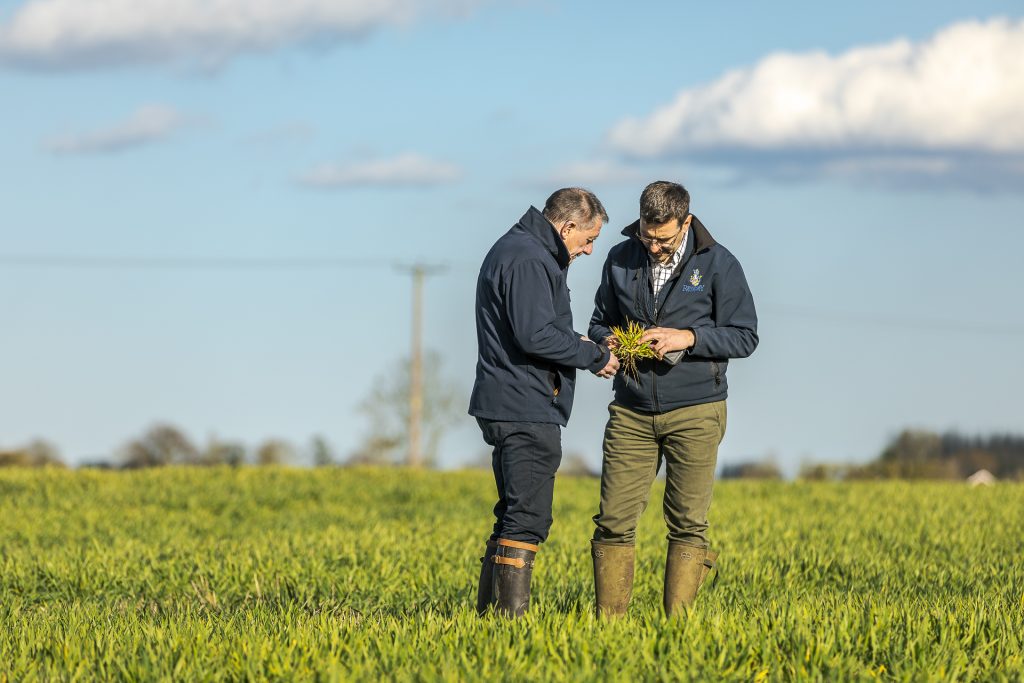
For the past five years, Matt and Roy have selected a challenge field each season where they test new ideas and try to push performance further.
One of the clearest lessons has been that improving the poorer areas of a field can be more effective than relying on the strongest areas to compensate for them.
This approach has helped move average wheat yields across the farm from 10 t/ha to 11 t/ha, with challenge fields expected to exceed 13 t/ha.
Using soil and yield data to build variable rate plans
RHIZA soil sampling provides the starting point.
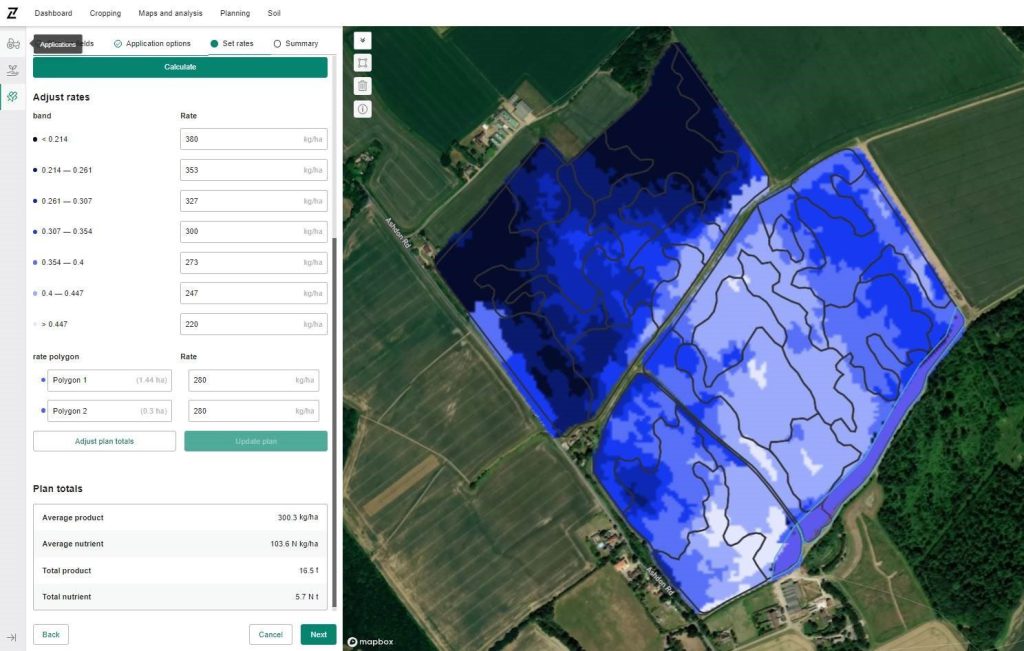
Historical yield maps, soil conductivity data and nutrient analysis are brought together in Contour, where variable rate seed and nutrient plans can be created and transferred to the tractor.
“To do this properly, we all have to be singing from the same hymn sheet,” says Matt.
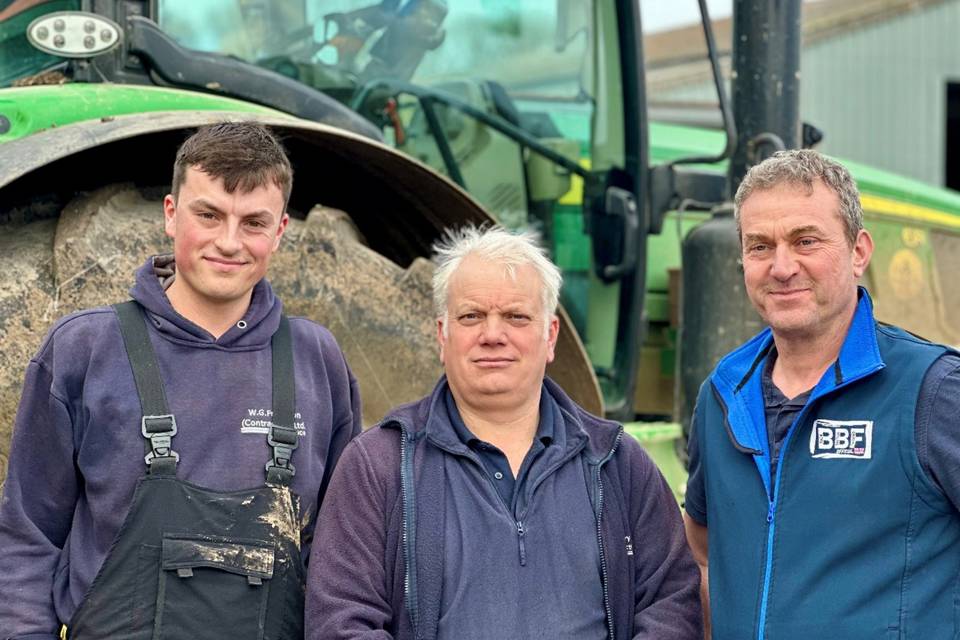
“That starts with Roy, Agrii and the RHIZA team, to me having the desire to go into this much detail across the whole farm, and finally the tractor drivers’ understanding of the technology and their willingness to use it.”
Matt says machinery support is also important, because the value of the plan depends on the technology working reliably in the field.
“If one part of that chain doesn’t play its part, then it all falls down.”
Variable rate seed for more even establishment
Variable rate seed plans typically alter seed rate by around 12% across a field, although Matt may adjust this further while drilling to reflect the conditions in front of him.
More fertile areas receive the lower rates, while exposed hillsides, chalk and heavier soils receive higher rates.
For early-drilled wheat, rates typically range from 280 seeds/m² in the stronger areas to 300 seeds/m² in the more challenging zones.
Later in the season, this increases to around 350 seeds/m² and 400 seeds/m² respectively.
Roy says the important point is not to follow a map blindly.
“For Matt’s farm, darker areas on a soil conductivity map indicate a nice, homogeneous soil. When conditions are perfect, we would want the seed rate to be lower in these areas because we don’t want the crop to be too thick.”
“If it’s wet at drilling, then we would switch that around and increase the seed rate in those areas, because establishment can be tricky on that soil.”
“The really important thing is to validate what the technology is telling us in the field and alter it if we think we need to.”
Variable rate nutrition through the season
The farm also uses variable rate P and K, along with a small trial of variable rate Calciprill for pH correction.
Variable rate nitrogen is another important part of the programme.
Most of the wheat area is Group 1 and Group 2 milling wheat, with total nitrogen applications typically between 250 and 300 kgN/ha depending on factors including previous farmyard manure applications.
“We split nitrogen quite a few times. The first application is usually 70 kgN/ha of protected urea. We follow little and often after this,” explains Matt.
This gives Matt and Roy several opportunities to review crop development and adjust later recommendations as the season changes.
Using satellite imagery to adjust decisions
NDVI satellite imagery in Contour is used to monitor crop growth and variation across the field during the season.
By the second and third nitrogen applications, Roy says there is usually a clearer picture of the likely crop potential and how weather conditions are influencing it.
“As we get to the second and third applications, we can get a better feel for the yield the crops will end up delivering, and also gauge the present weather pattern.”
“Do we need to feed them to achieve a 10 t/ha yield or a 13 t/ha yield?”
The aim is not to push every part of every field for maximum output regardless of cost.
“We can’t do anything about the weather, but our whole plan is about making the crop as resilient as possible. We’re trying not to spend too much for the last 5% of yield,” says Roy.
Keeping the data accessible to the whole team
For Matt, one of the most important parts of precision farming is making sure the information can be used easily by everyone involved.
Contour acts as the common platform for soil information, maps and prescriptions, helping Matt, Roy and the tractor operators work from the same data.
“Contour is a big step forward to help us manage this, and it’s getting better,” says Matt.
“The technology has to work, and be quick and easy to use. If one of our team members is in the field and they can’t get something to work, or if we can’t get information to them wirelessly, then all our efforts have been wasted.”
Improving average yield without a major rise in variable costs
The farm’s focus on improving weaker-performing areas has helped move its average wheat yield from 10 t/ha to 11 t/ha.
Its challenge fields are expected to exceed 13 t/ha.
According to Matt, this improvement has been achieved without an appreciable increase in variable costs associated with the technology.
The emphasis remains on targeting inputs where they are most likely to improve crop performance, rather than simply applying more across the whole field.
What could come next?
One development Matt would like to see within Contour is yield prediction.
He says a reliable forecast of likely field output could help refine later-season nitrogen decisions, particularly in milling wheat.
“If, for example, we know a field is set up to yield 11 t/ha of a Group 1 milling variety, then we would know that we need to push the later nitrogen application.”
For Matt, the objective remains straightforward.
“Our aim from the moment we plant is to get an even crop. The end point is output, we aren’t afraid to spend, but we have to do it in the right way.”
Using variable rate technology as part of the agronomy
The experience at WG Fry & Son shows how variable rate technology can support agronomy when it is built around field knowledge rather than used in isolation.
Soil conductivity, nutrient analysis, yield maps and satellite imagery each provide a different part of the picture. The value comes from combining those layers with field observations and adjusting the plan when conditions change.
Speak to the RHIZA team or your Agrii agronomist about using soil data, satellite imagery and Contour to build variable rate seed and nutrition plans for your farm.