Variable Rate Nitrogen: Time for Change?
30
MARCH, 2023
Blog
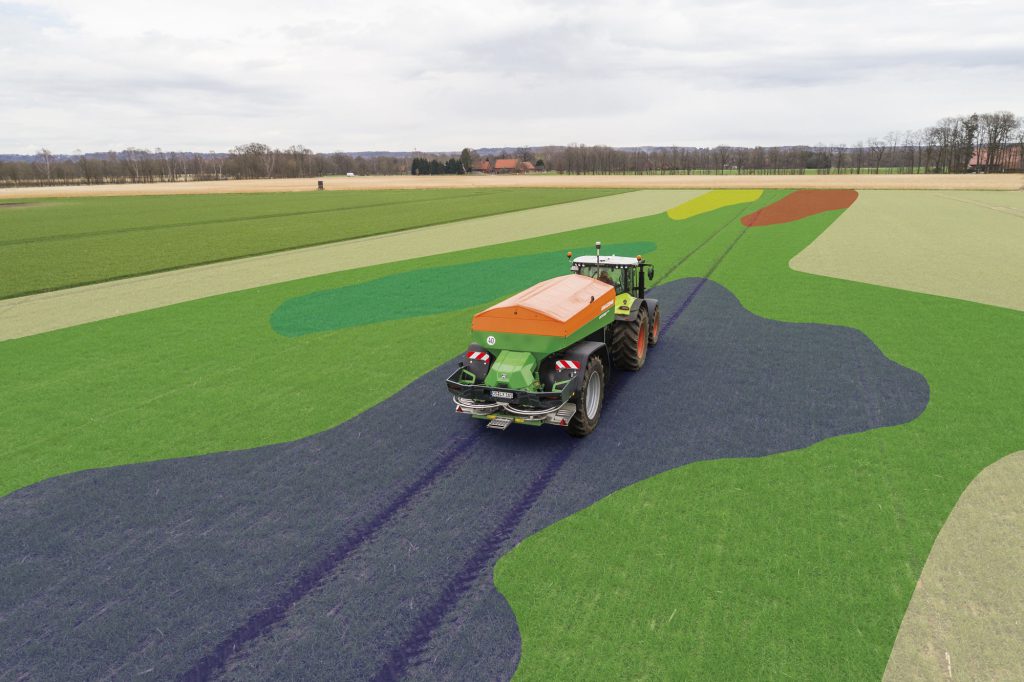
In a previous article, the idea of a change in strategy in Variable Rate Nitrogen (VR N) applications was highlighted as something for growers to consider. Traditional approaches to VR N have promoted the use of more nitrogen applied to lower biomass areas to promote tillering in the first nitrogen timings. However, with all these things, the proof is in the pudding.
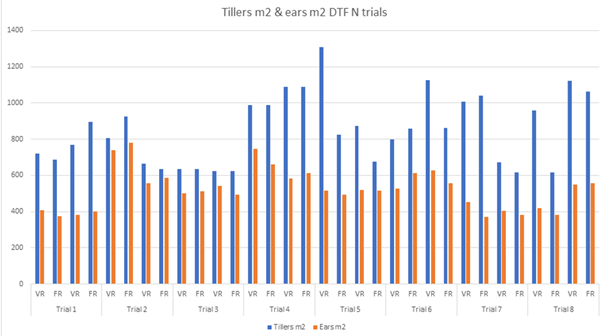
In RHIZA’s VR N trials focusing on the N1 & N2 timings and applying more nitrogen in poorer areas to promote tillers, there was an increase of around 50% in tillers in the variable rate tramlines verses the adjacent flat rate plots. However, that increase was not necessarily reflected in the ear count or the yield results. This was due to several reasons – mainly weather, soil type and the wheat’s amazing ability to compensate for the conditions. Therefore, this does pose the question: Is the reward of adopting this strategy worth the risk? With the current volatility in fertiliser and grain markets, this may no longer be the case.
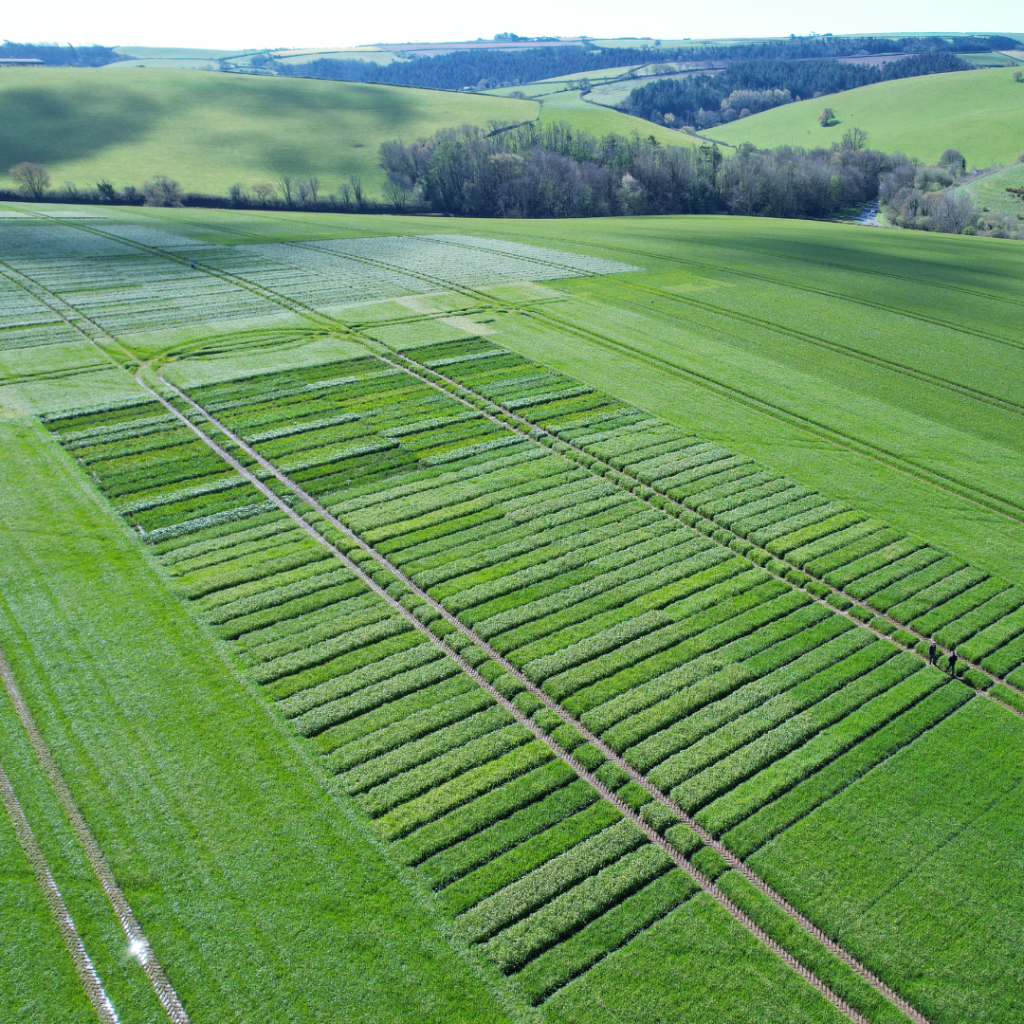
A comparison of tiller count versus ear count in the VR N trials conducted by RHIZA in parternship with Agrii.
In Spring 2022, several RHIZA customers were questioning the traditional approach to nitrogen applications, with a further few enquiring if there was a better way to utilise what was at that time a very expensive input. Working with the agronomist on the farms we looked at a ‘feed for potential’ strategy across all applications. Whilst this is a bold move and does require full commitment from all parties involved, it does make financial sense – only apply to what is there in the field.
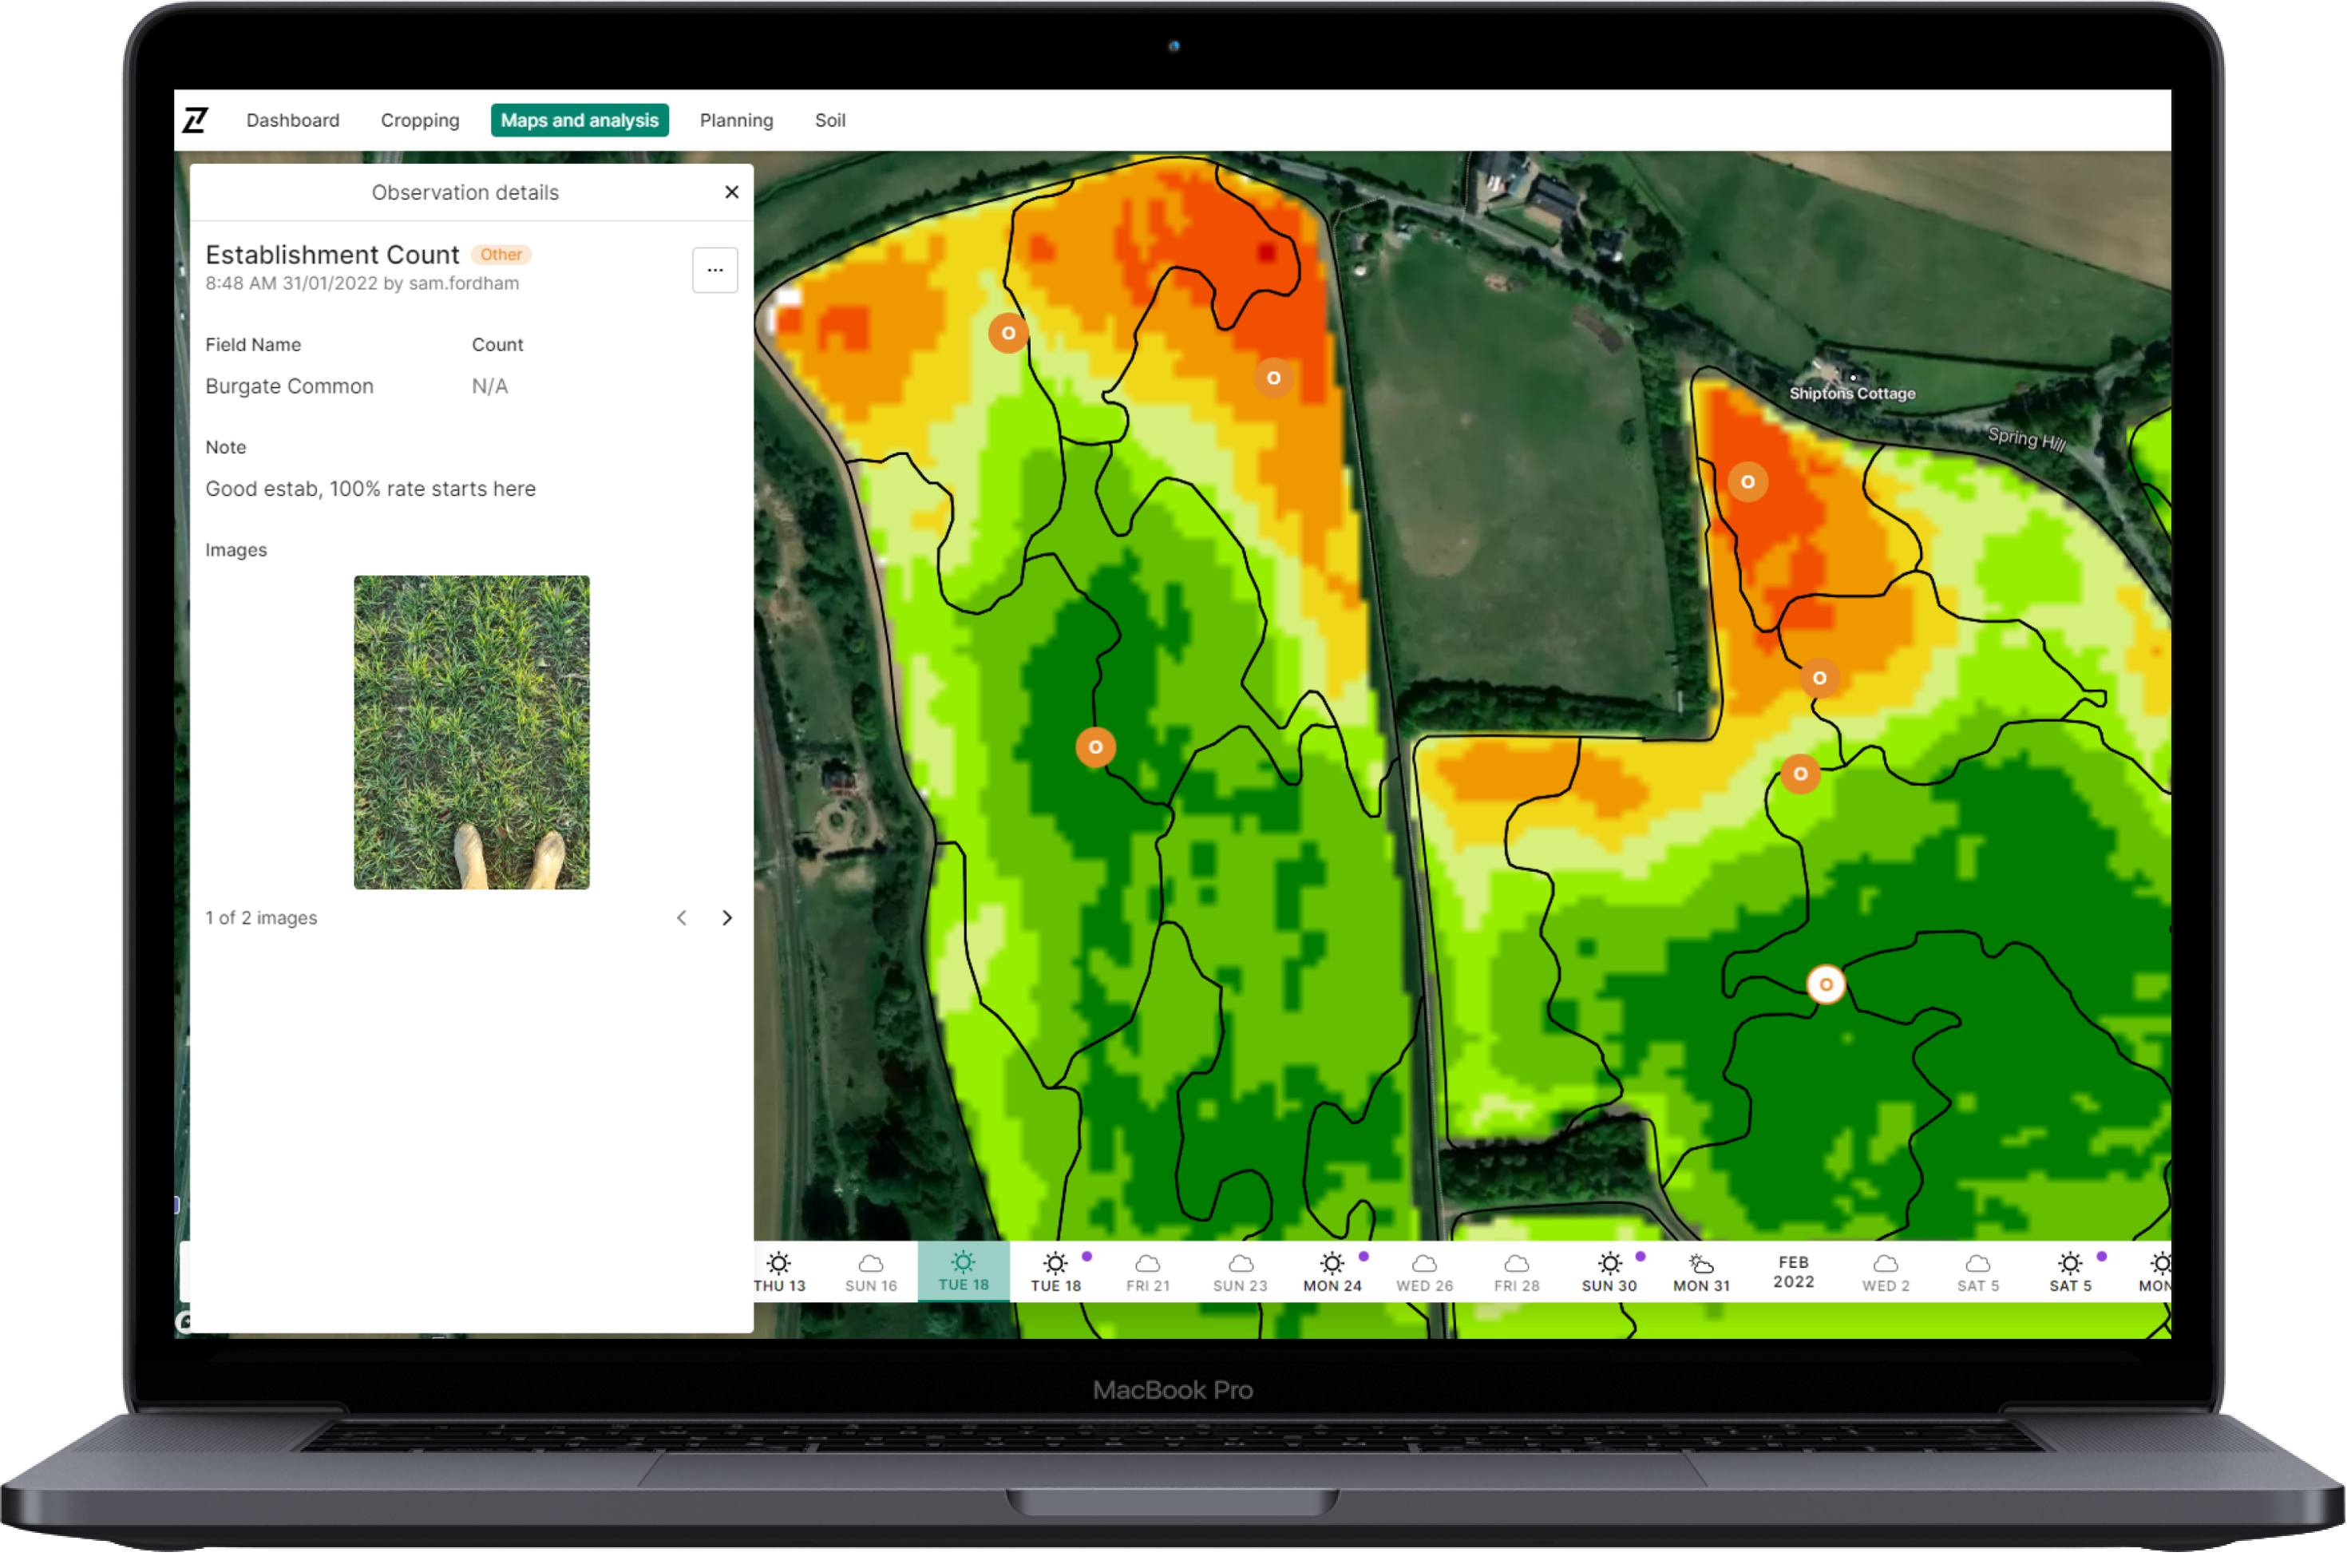
Having walked the crops emerging from Winter, Agrii agronomists and farmers recognised there was enough variation in the cereal crops for VR N to be a beneficial approach. After realising that there were some areas of fields that had already compromised yield potential due to poorer establishment, an approach was developed to be ruthless with the nitrogen inputs. With winter wheat prices touching £300/t, there is always a temptation to push for yield, so managing the balance between where to push and where to save was key.
Approach
N1
Following initial field walks, it was decided that every part of the crop should receive some nitrogen as it was too early to disregard some areas as low input. Coupled with the fear of another dry spring and previous good results from “front-end loading”, the areas with the highest biomass were targeted with a high early dose. An application of 40kg/N on the poorer areas, and up to 120Kg/N on the highest biomass areas was planned.
N2
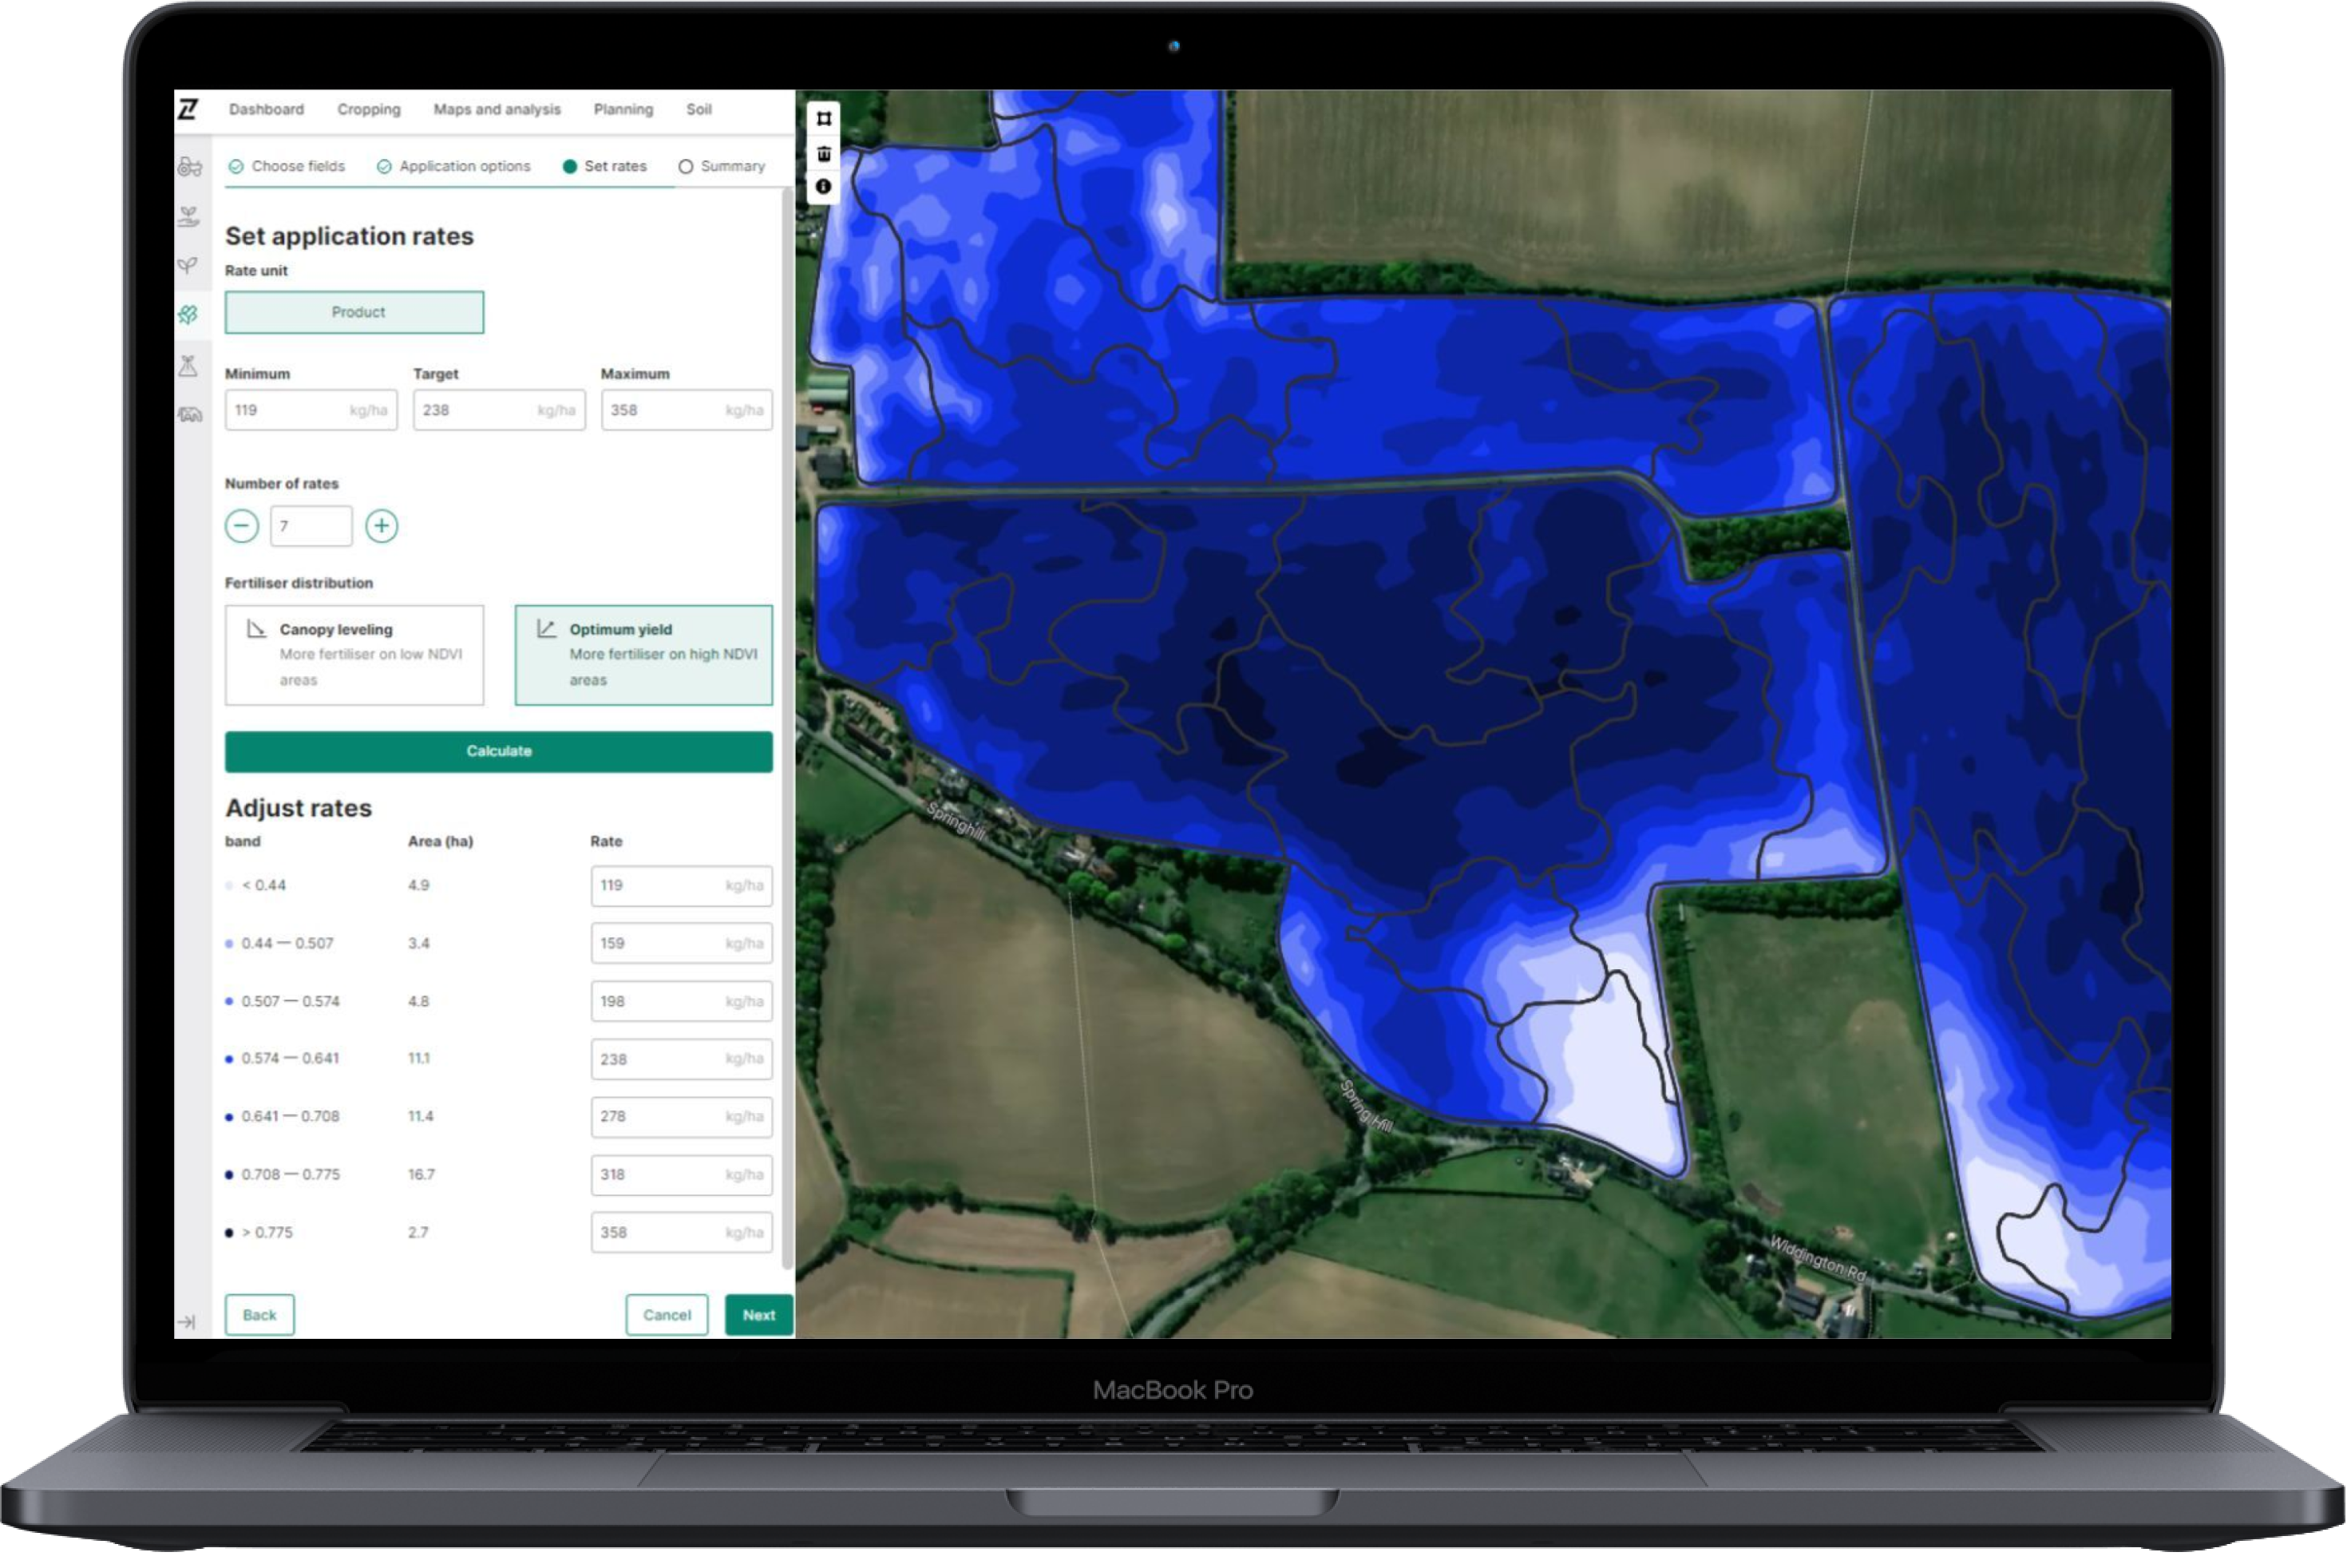
By the N2 application three weeks later, the crop had advanced enough to give a much better idea of potential as well as a clearer indication of how the weather was going to influence the season. With another dry Spring looking likely, a decision to concentrate on the areas of most potential was taken. Typically, the heavier soil types were further advanced, which was evidenced in the satellite imagery. Any part of the fields that had either rabbit damage or sub-optimal plant stand would not receive any nitrogen in this application. A range of 0 Kg/Ha to 98Kg/Ha was applied.
N3
By the last dose in early April, there were clear signs to indicate what the Spring had in store. As with previous years, the last significant rainfall was around the second week of March. At this stage, analysis of previous yield maps and satellite imagery showed where yield had been achieved in dry years, which meant trends could be spotted in the current satellite imagery. With no reasonable amounts of rainfall predicted for the next two weeks, the potential of the lower biomass areas was falling rapidly. For the N3 application the crop was walked again and biomass scores taken to quantify the nitrogen need. Again, it is important to remember that there are risks around capping the yield potential. However this can be mitigated to a degree by using Contour to assess and analyse soil type, previous yield or satellite imagery and weather data, although some luck with the weather is needed. With this application the nitrogen was varied from 0 to 50 Kg/N.
Harvest
Waiting for the numbers to start appearing on the yield monitor in the combine is always a nervous time. Having used such a bold strategy with nitrogen, there was some uncertainty – however in this case, the figures were illuminating.
The lowest biomass areas received a total of 50kg nitrogen whereas the highest were up to the crop requirement of 268kg nitrogen. The yield variation was from 4.9t/Ha in the lowest areas up to 11.6t/Ha in the highest. When taking an average price from last year of £600/t for AN, the £/Ha spend would range from £30 in the lowest yielding areas and £465 in the highest.
There are some obvious questions around the lower biomass areas in the crop which only received 50Kg/Ha. If more nitrogen had been applied to those areas, would more yield have been achieved? Would the crop have been so variable if the weather had been different? This is the gamble taken every year. Without a crystal ball, the available data must be used and diversions from the norm must be taken, when the norm changes. With weather patterns changing rapidly and the price of all farm inputs steeply increasing, growers may need to be more ruthless and worry less about a picturesque crop and place more emphasis on gross margin at field and sub-field level.
To find out more about how to get the most from VR N on your farm, or to explore other input options, please speak to your local Crop Inputs Specialist or click the button below.
Written by Sam Fordham
Head of Technical for RHIZA